
Tree Maps
Tree Maps are a type of visualization well suited to representing categories and relationships within large data sets. Tree Maps consist of a series of nested nodes, which can be arranged in terms of order, hierarchy, and importance. You can easily represent tables and elements with Tree Maps based on your ServiceNow data in UPMX.
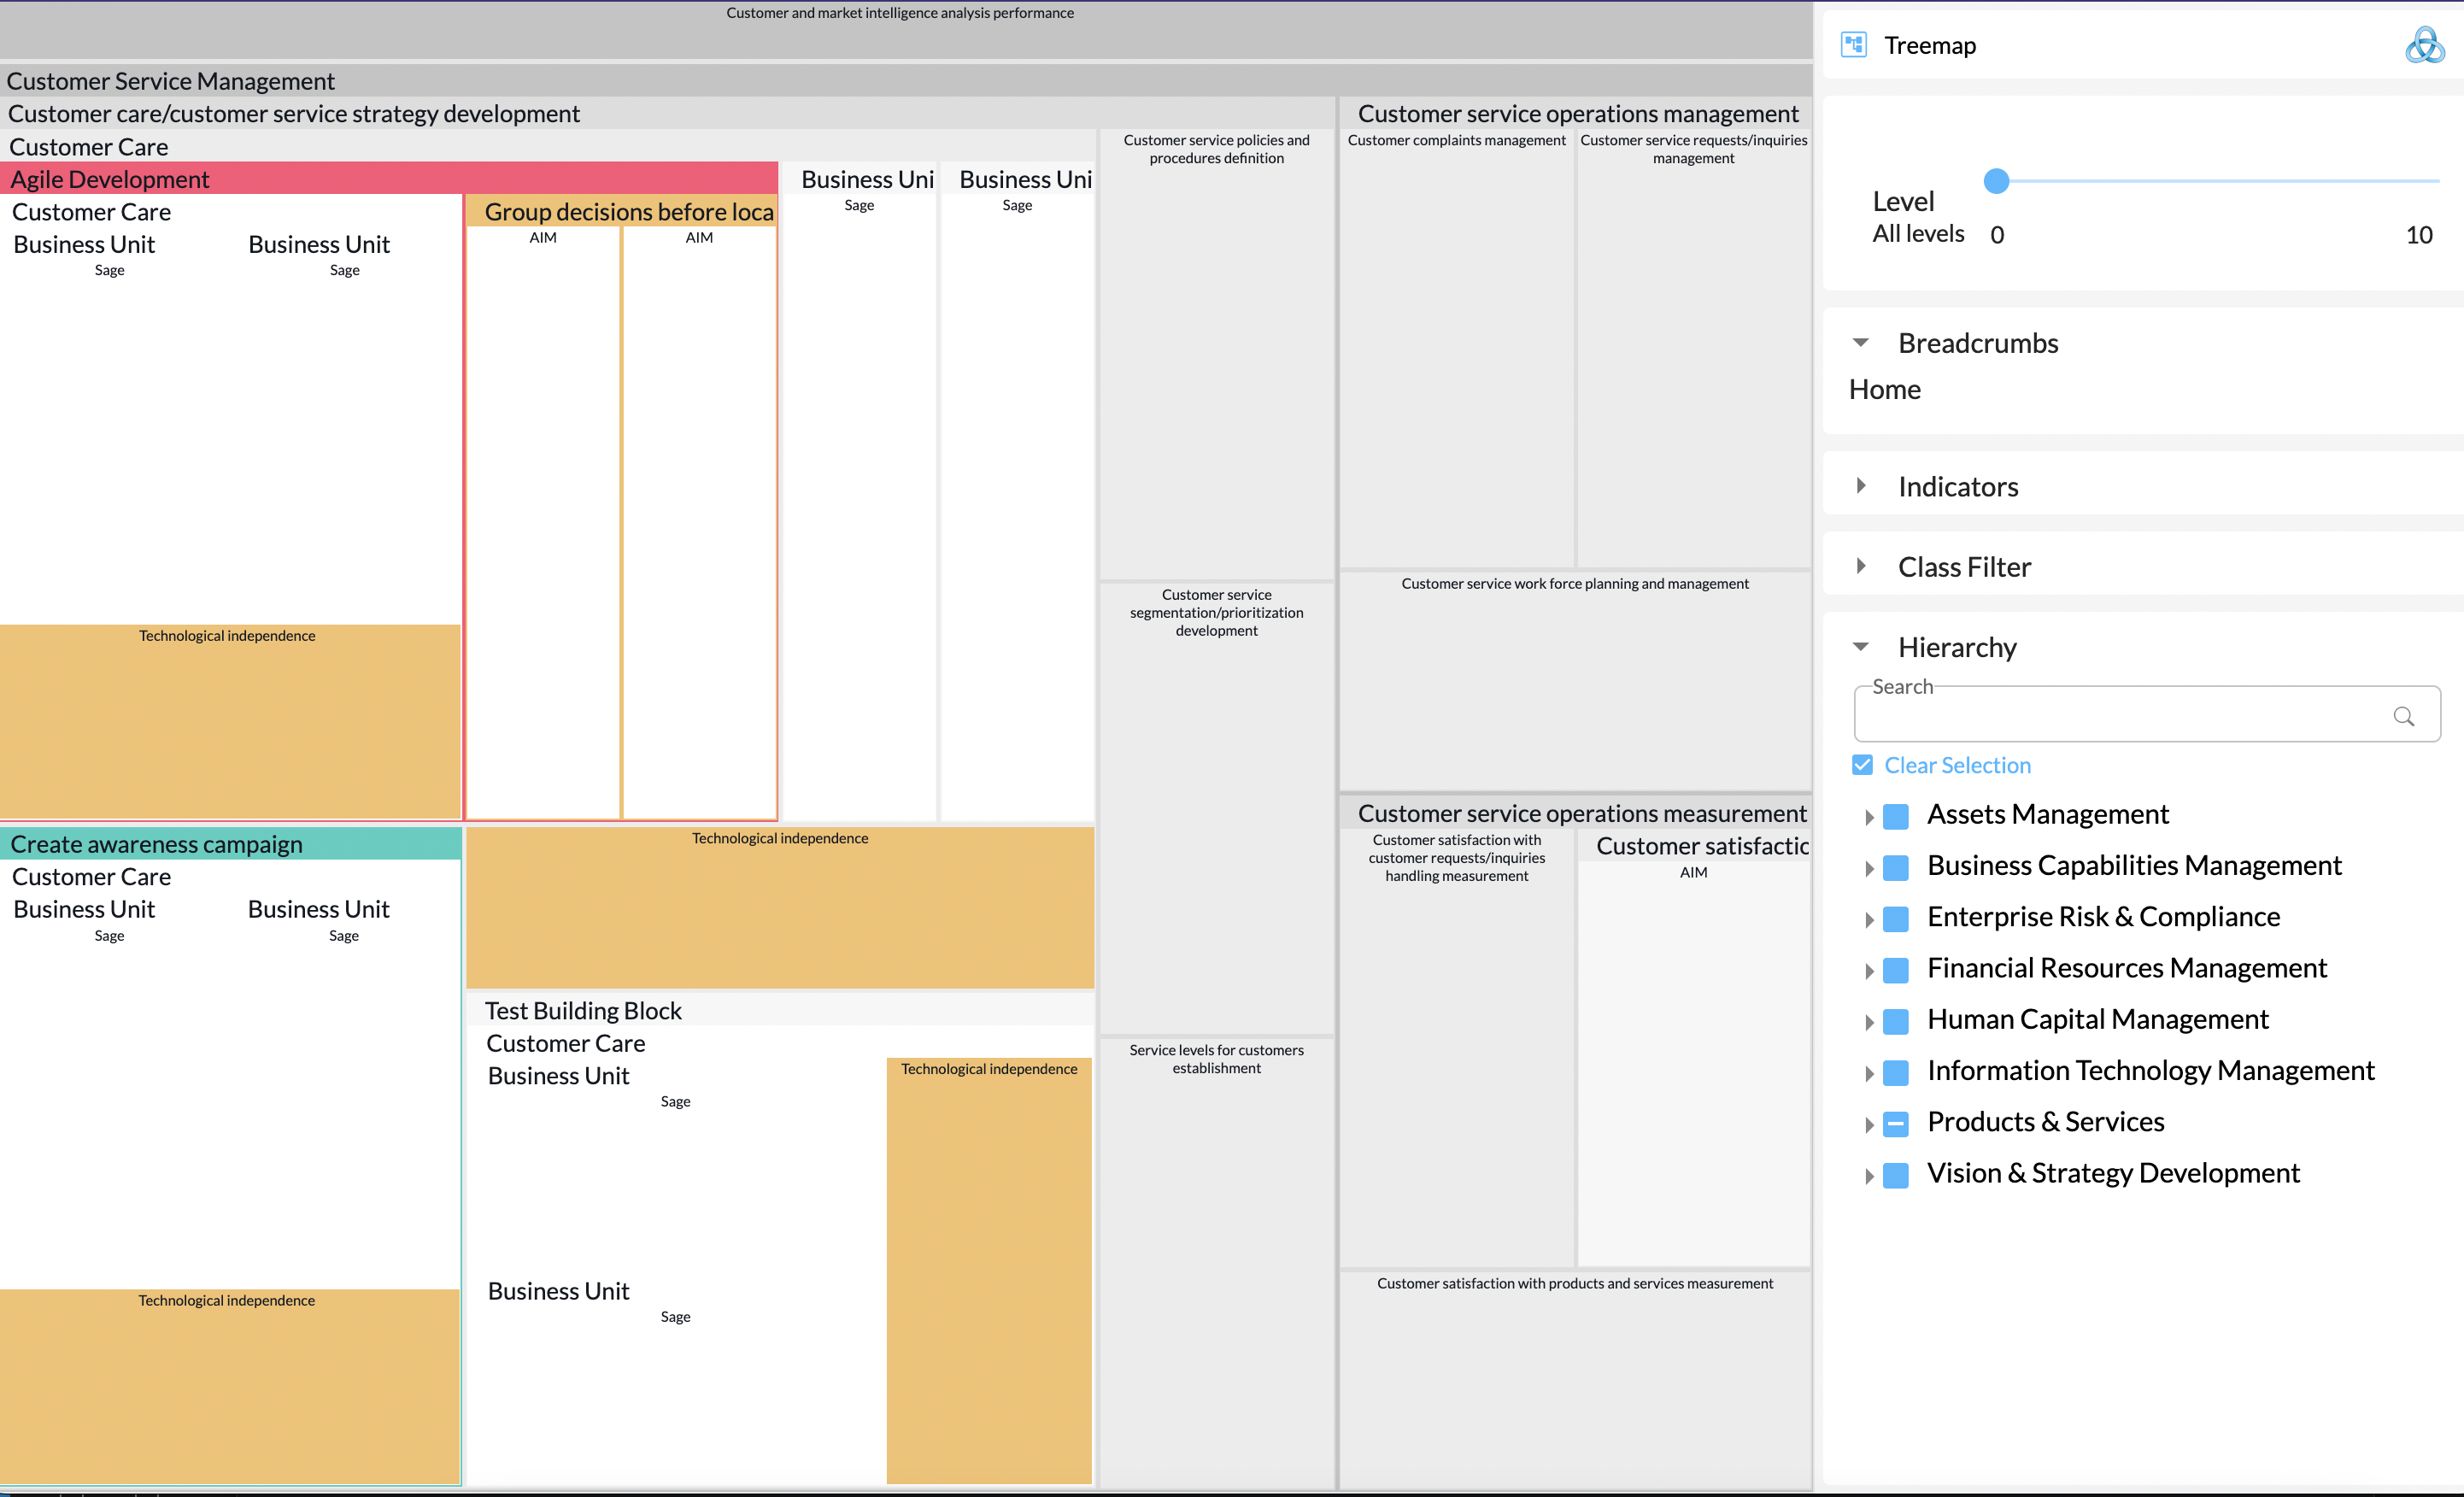
Tree Map
Create a Tree Map
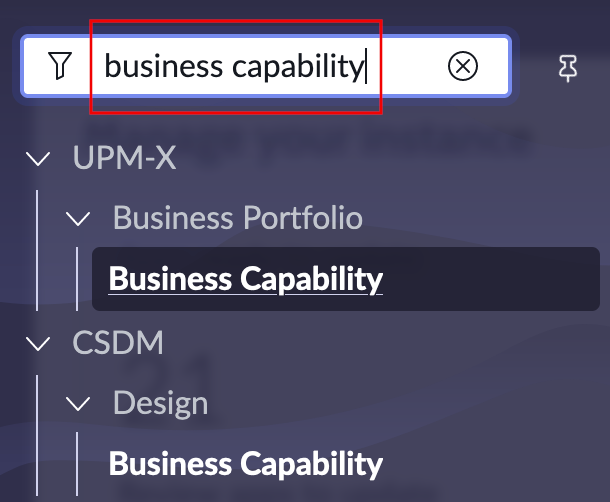
- Launch the Application Navigator and filter for a target table.
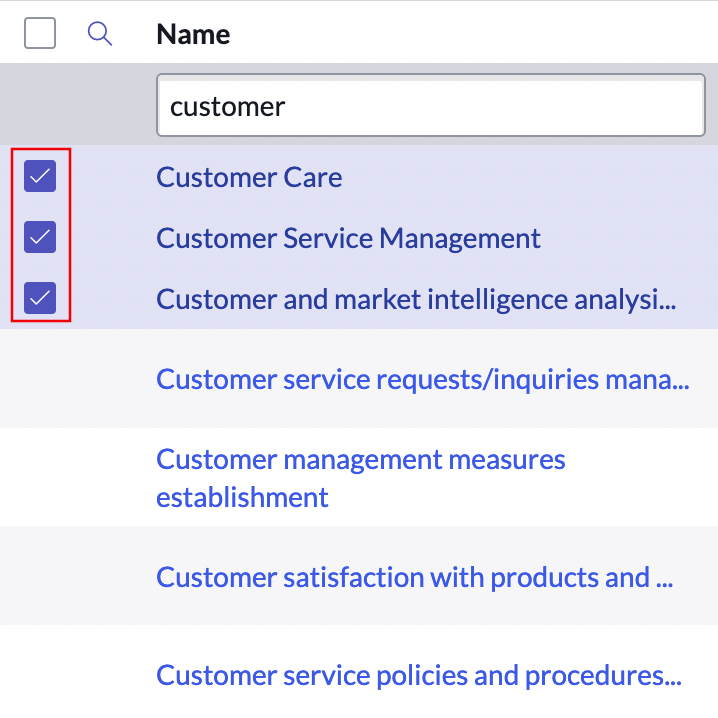
- Select the checkboxes for one, or multiple elements, to build a Tree Map.
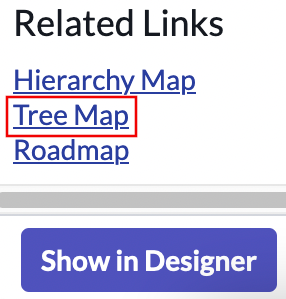
- Scroll down and select Tree Map.
UPMX will generate a Tree Map based on the elements you selected.
The Tree Map interface
The canvas consists of the selected elements arranged in a series of colored nodes according to hierarchy and importance.
- Level : Specify the number of levels of data to show, fewer levels will generate a simpler diagram
Setting Level to 0 will show all available layers

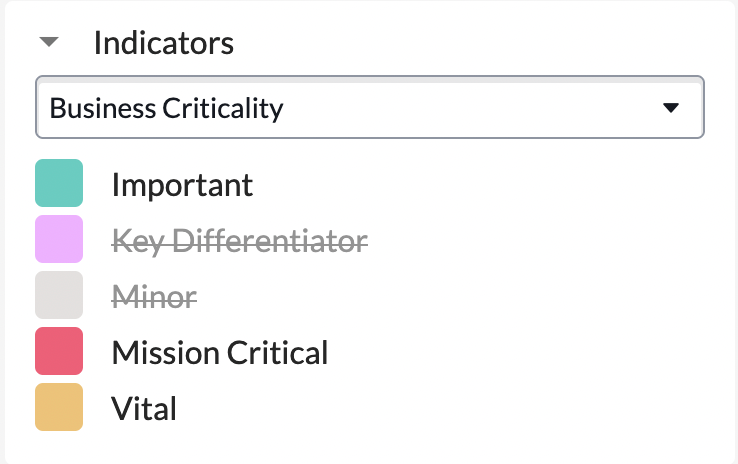
- Indicator : You can toggle on and off indicators by selecting indicators. If an indicator is unavailable for the Tree Map it will have a line through it and you cannot select it.
- Class Filter : You can toggle classes on and off by selecting the checkbox associated with each class.

- Hierarchy : You can add or remove elements from the visualization

Updated about 1 year ago